How to make the invisible visible?
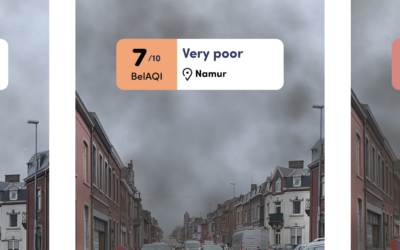
In order to increase the awareness of citizens about the pollution from traffic on the road? We can see an air quality score sometimes, but this remains generally very abstract.
So, how can we make the pollution visible? How can we represent data in a way that can be understood, in a way that creates an impression on people, so they get nudged to opt for a greener way of transportation? How can we visualize the link between trafic and pollution? And how can we make it interactive, so people can almost feel it?
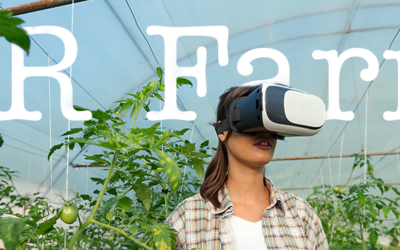
This was the starting point of our reflection. Our design questions. We started to sketch concepts, like “pollution should be visualized a clouds”. The technology that seemed the most appropriate was #MixedReality, given that it’s very immersive, but also interactive (thanks to the gesture recognition).
We looked for smartcities that are equipped with air quality sensors, in order to feed our concept with data. Namur being a pioneer SmartCity (with open data set and 3D modelling) and also hosting the Kikk festival (where we intended to showcase our app), it appeared as the perfect candidate.
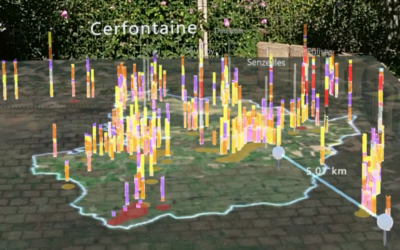
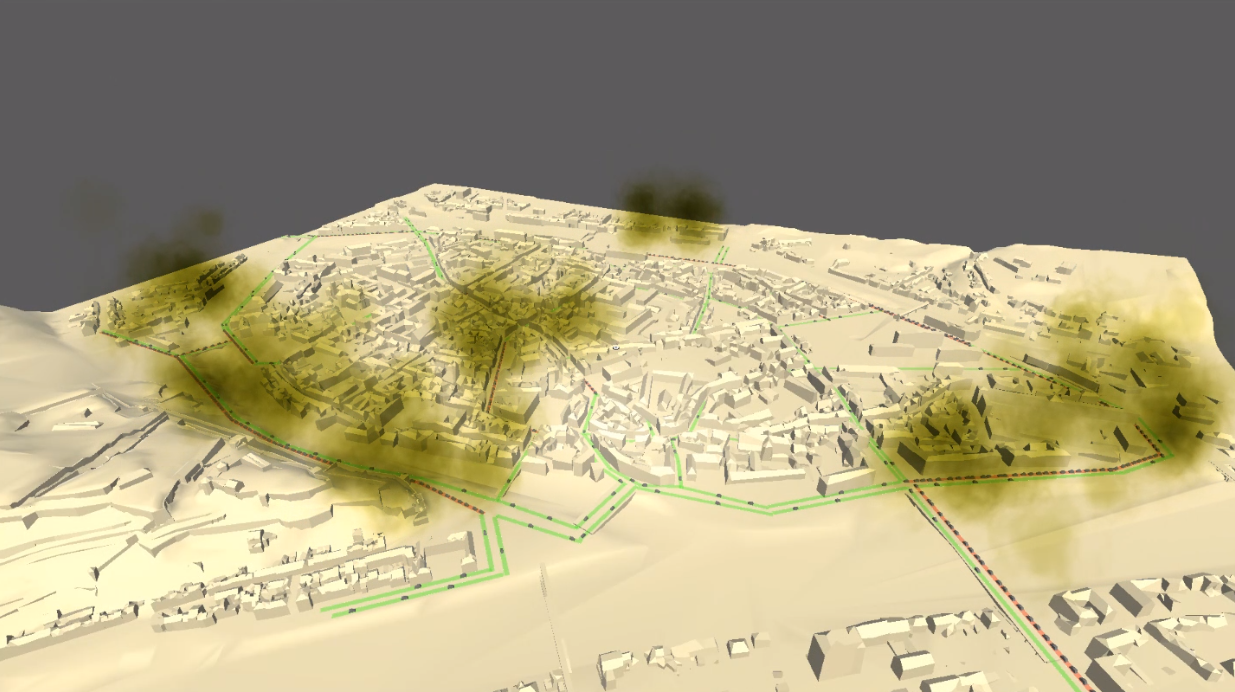
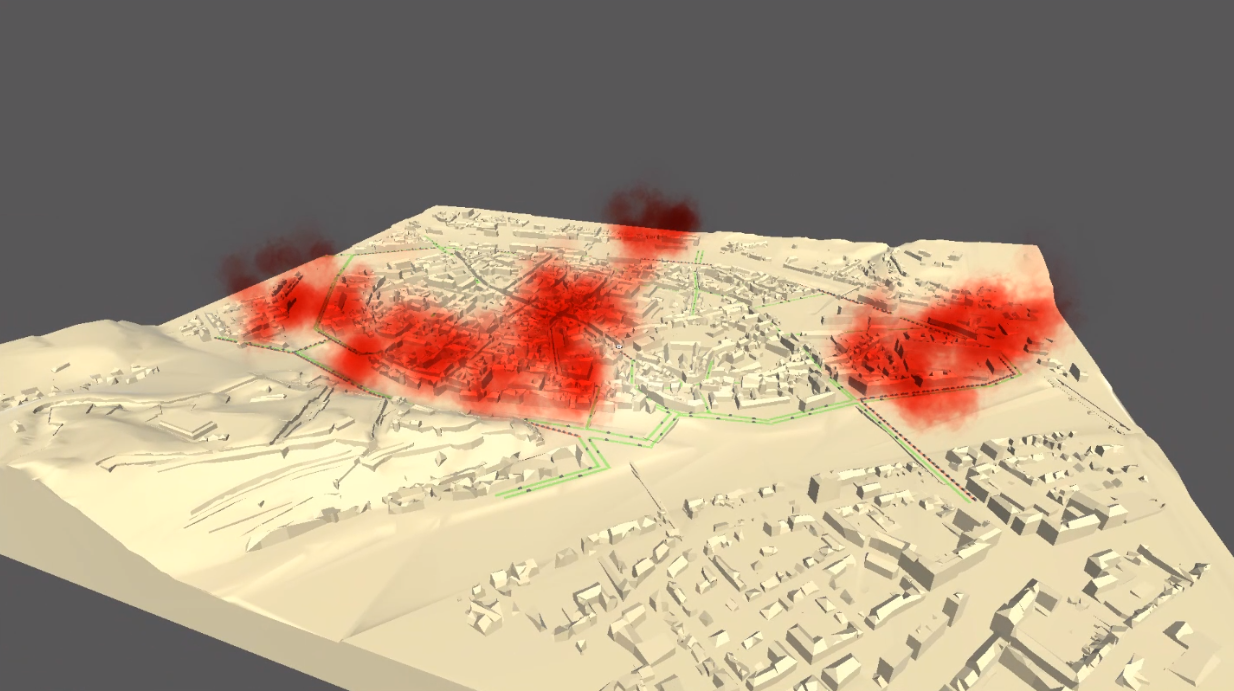
We mapped traffic data, represented by cars and colored segments, then mapped the air quality label as a color code on the clouds: blue clouds would mean that the air quality was good, yellow clouds mean a average air quality, and red clouds a very bad air quality, or high pollution. But it didn’t convey the message well, as you can see below.
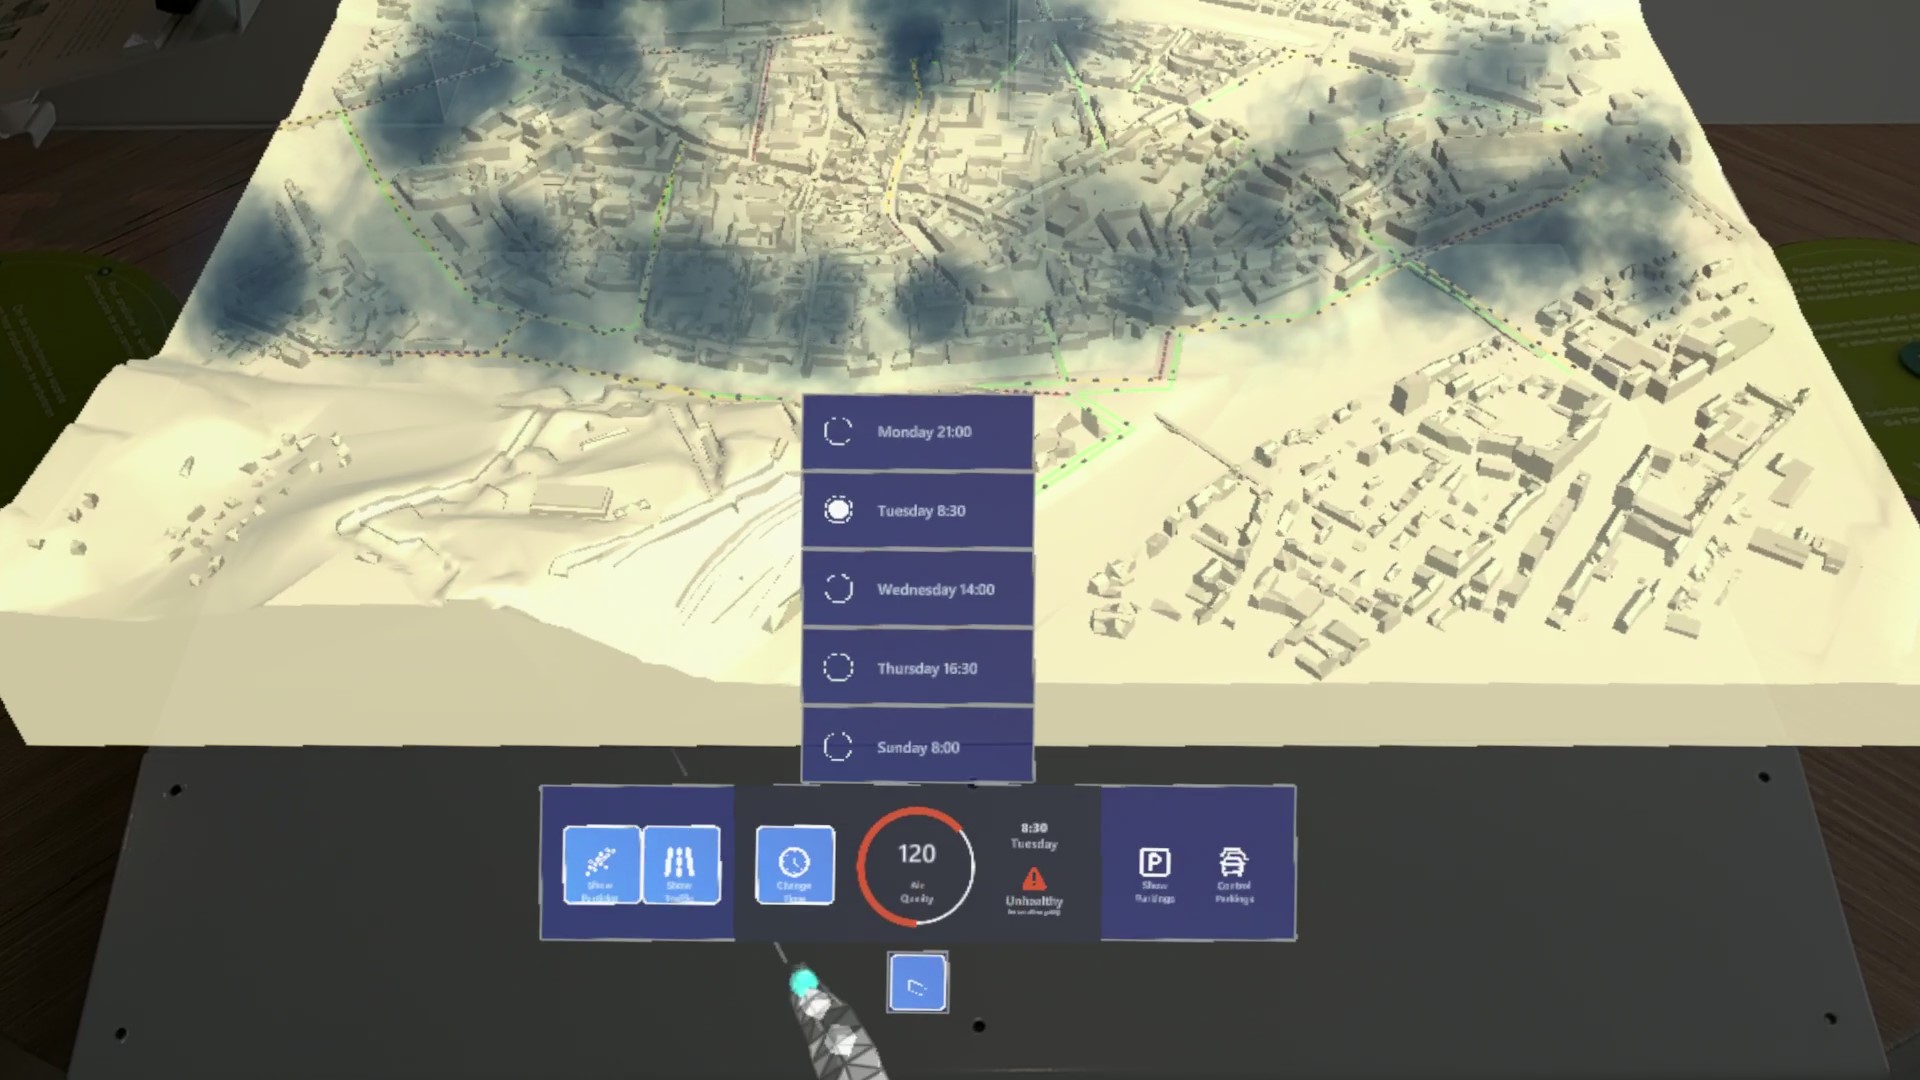
We therefore opted for black clouds for all types of air quality, playing with their intensity to show more or less pollution. Real-time data vizualization was possible, thanks to the data of the sensors, but it didn’t convey the message, so we decided to agregate data in order to make it easier to understand: users can air tap on 5 key moments of the week, in order to see to related traffic and air quality.
So this remains a “proof-of-concept”, today citizens can visualize this link and hopefully opt for a greener way of transportation, but we strongly believe that tomorrow, decision-makers will use such tools in order to manage urban planning and make better, more informed decisions.
Do you want to try this out?
Our app, based on Hololens technology, is showcased at Le NID in Namur, and can be tested by anyone. For opening hours, please visit their website www.le-nid.be